
Data Visualization & Decision Tools
What does the information need to help someone decide?
A chart can show a pattern. A useful decision tool also makes the context, comparison and possible next step understandable.
We design how people explore information, compare conditions and interpret change. Our work connects data structure, visual communication, interaction and the decisions a platform is intended to support.
-
Before choosing a visual form, we establish who will use the information and what they need to understand. This helps define relevant measures, comparisons, levels of detail and the context required to interpret them.
-
Operational information often comes from different systems and teams. We consider how definitions, reporting periods and levels of detail fit together, then design interfaces that help people move between an overview and the information behind it.
-
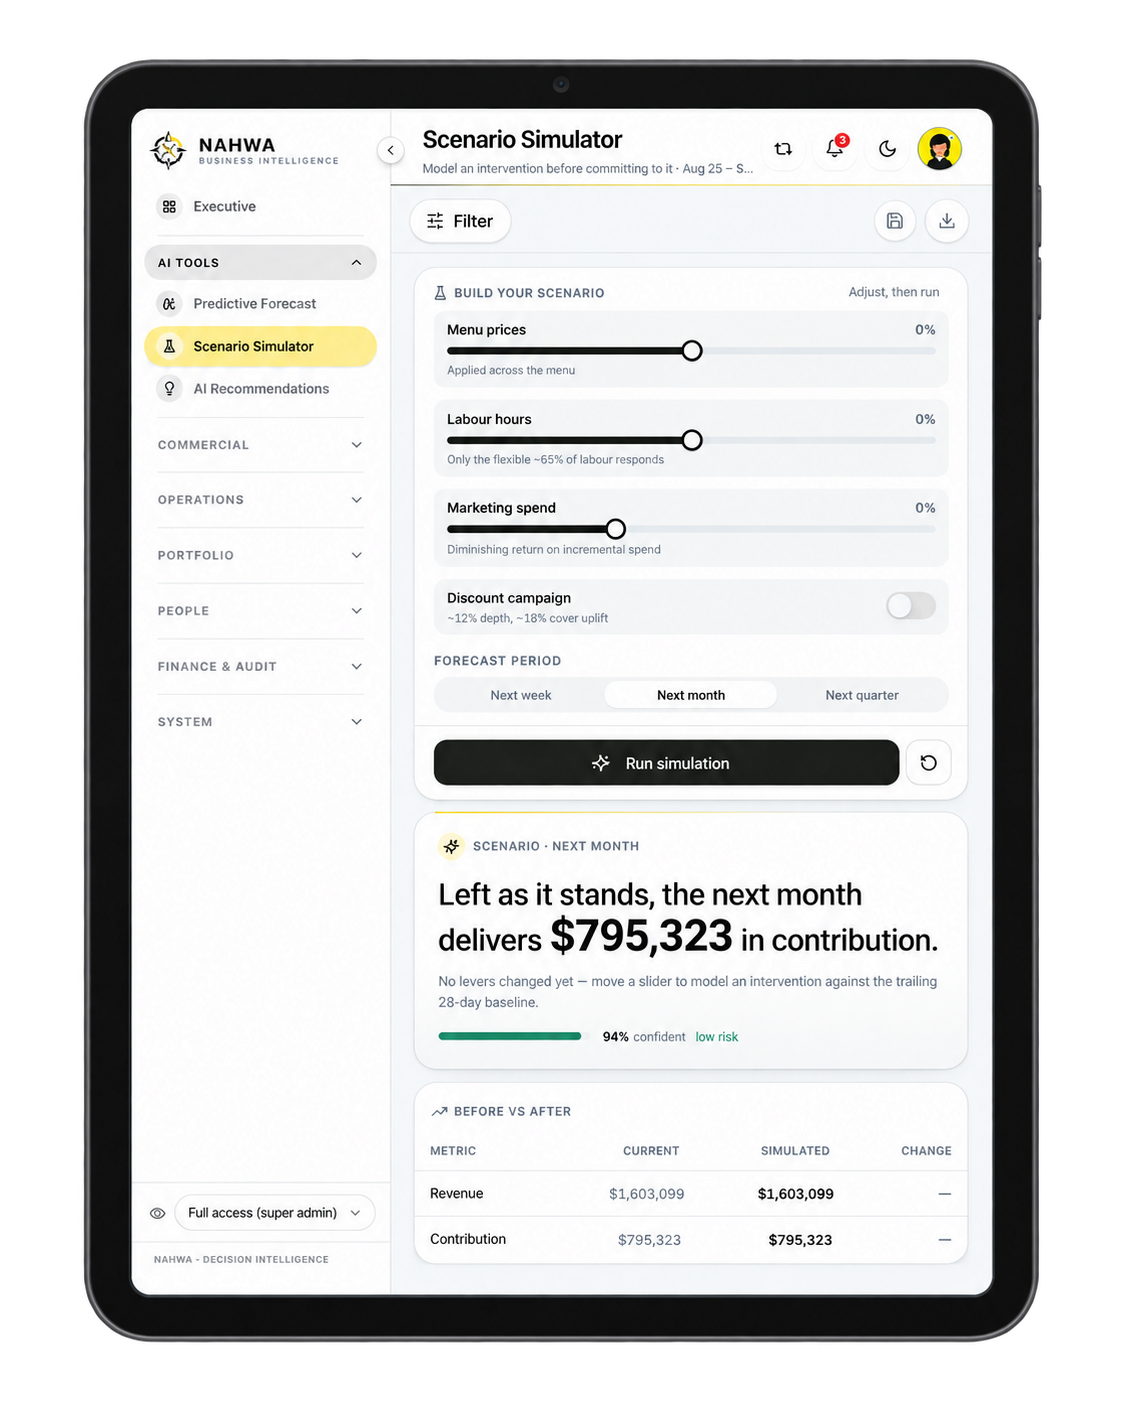
Forecasting and scenario tools need clear assumptions. We design experiences that distinguish recorded data, model outputs and user-defined scenarios, making uncertainty and limits visible where they influence interpretation. A forecast supports consideration of what may happen; it does not establish what will happen.
-
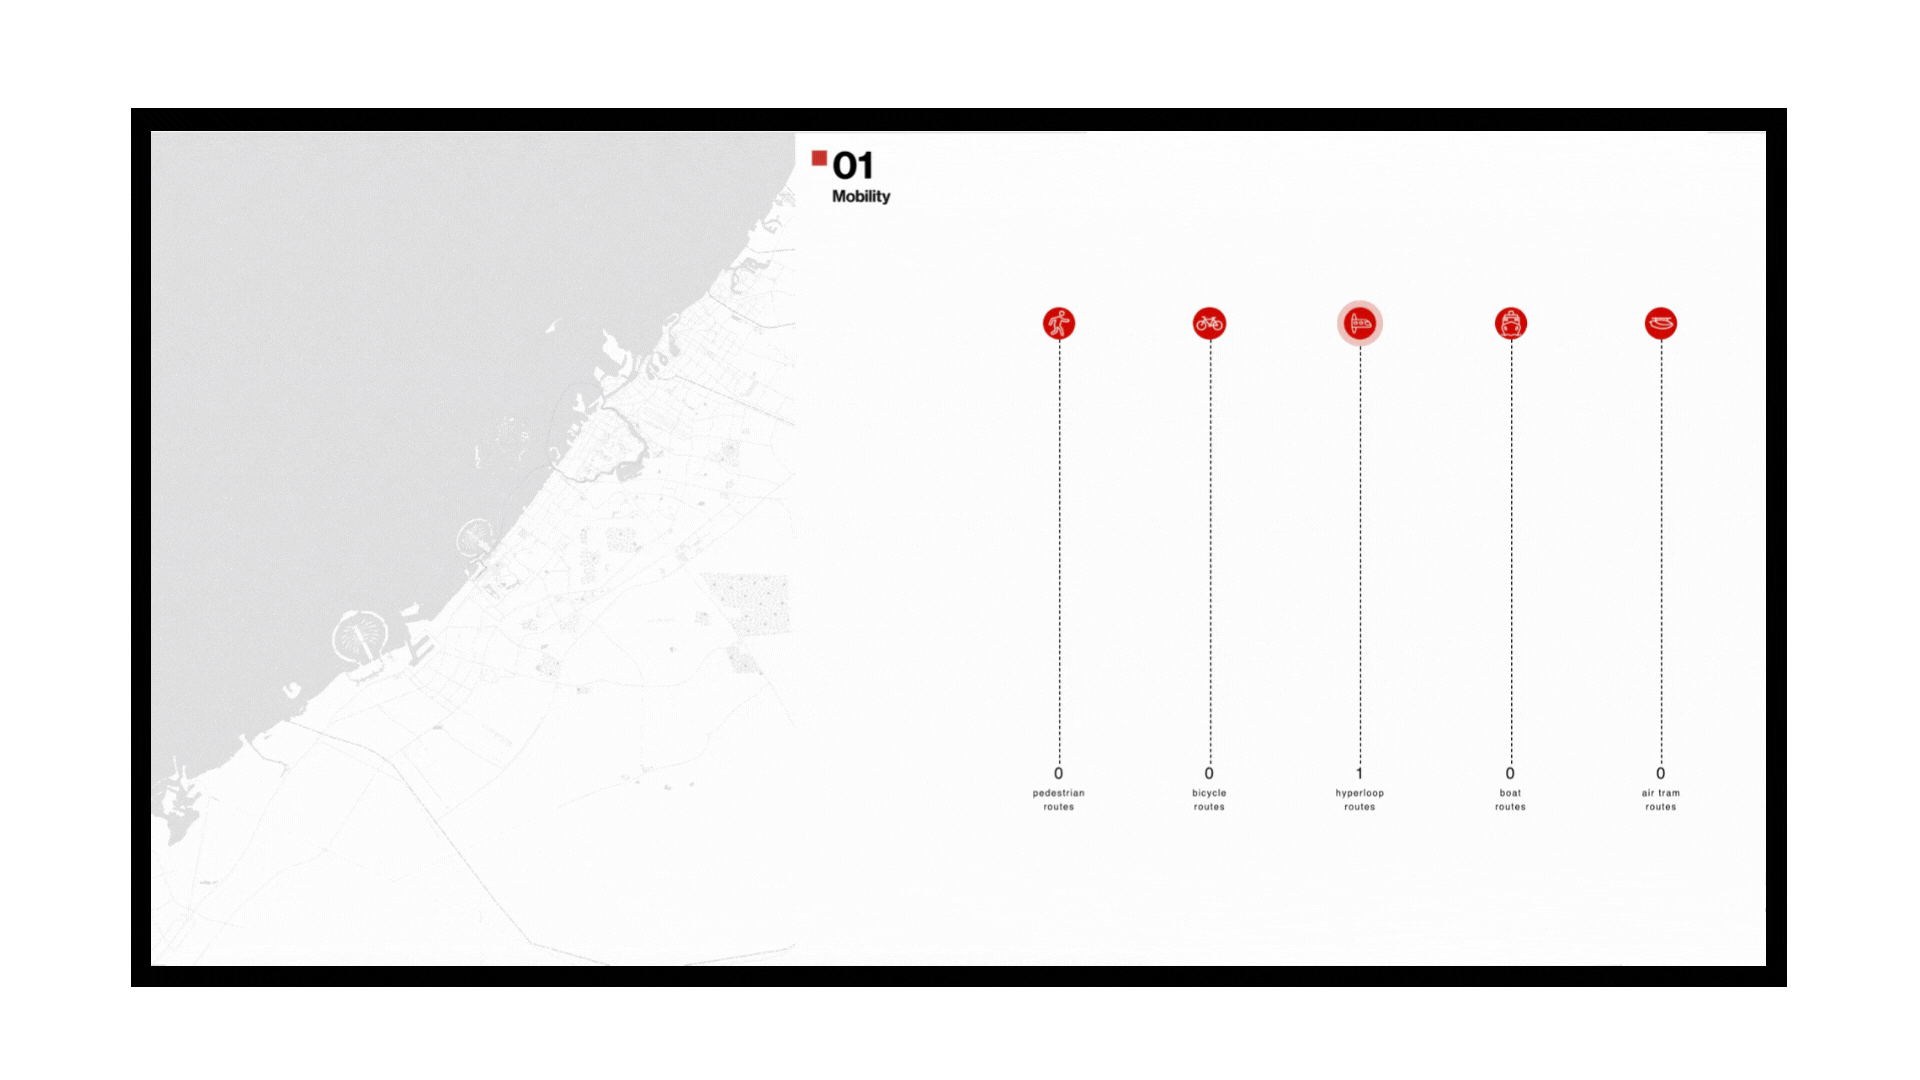
Interactive maps and visual tools can help people understand a place, contribute local knowledge or compare possible changes. We design participation around accessible questions and explain how contributions relate to the wider information being presented.
Our approach
Selected work
-
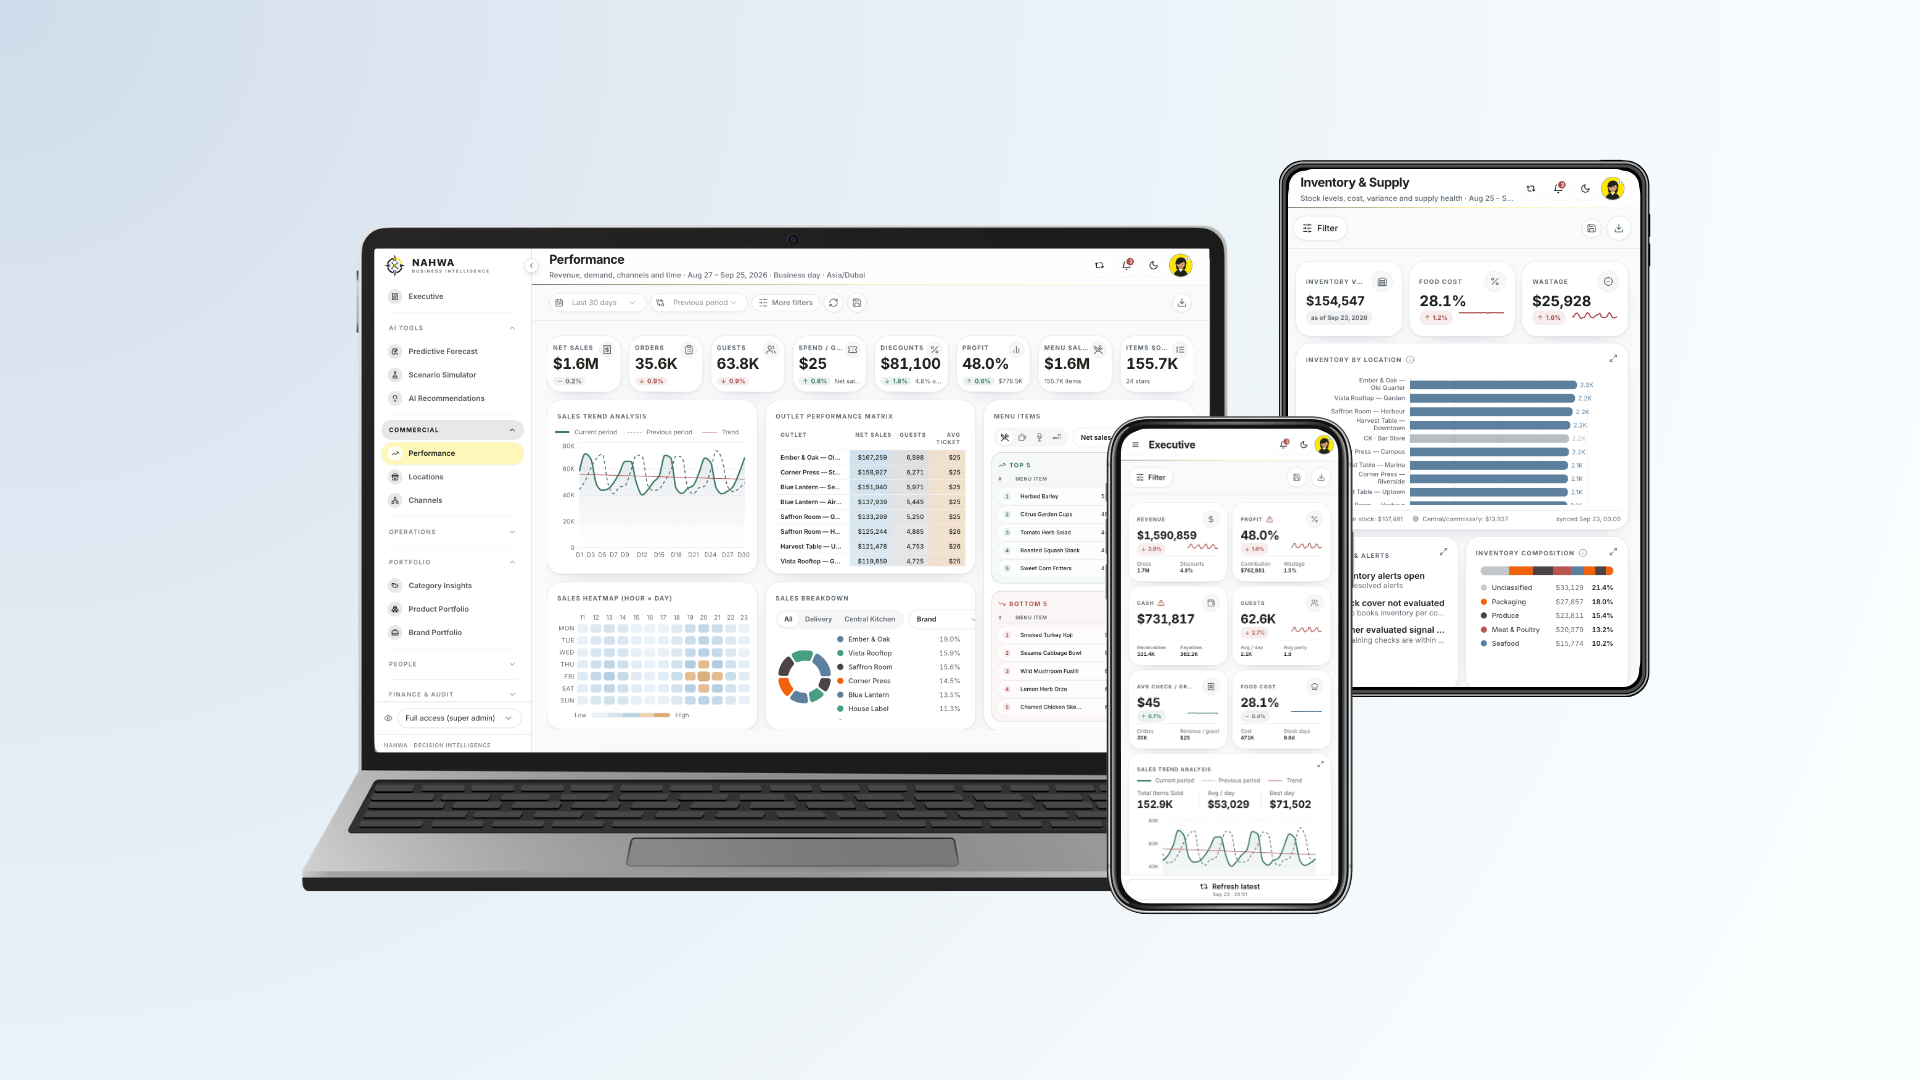
An IBDÅ business intelligence venture bringing performance monitoring, analysis, forecasting and reporting into one configurable environment.
-
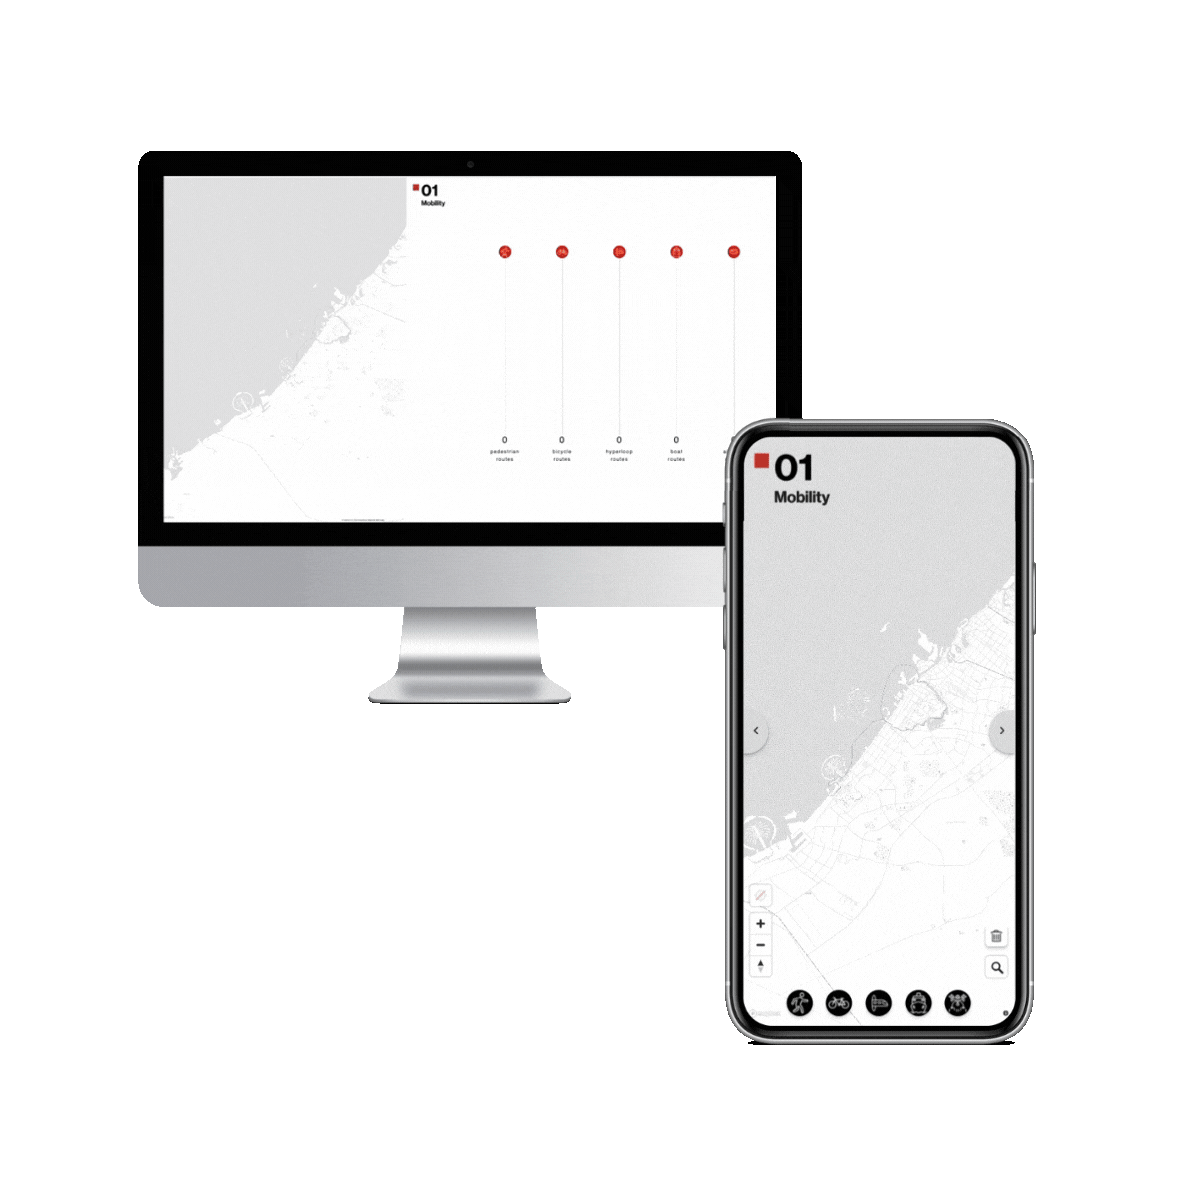
An interactive installation and web application developed for Dubai Design Week 2021, connecting the presentation of the Dubai 2040 Master Plan with opportunities for public participation.
What we can explore together
A business intelligence interface. A public observatory. A scenario exploration tool. An interactive map. A dashboard that needs to make priorities clearer. A platform that connects contributions from different stakeholders.
For development and integration, explore Digital Products & Platforms. For public-sector services and programs, explore Government Innovation.
Related expertise: UX/UI Design · Interactive Environments
Questions worth asking
-
We can begin by reviewing your sources, definitions and intended decisions. This helps reveal what can be prototyped now and what needs further data work.
-
Where suitable sources and access are available, live or regularly refreshed information can be integrated. Update frequency and data quality should remain clear to users.
•
data structure
•
visual communication
•
interaction
•
business intelligence
•
forecasting
•
scenario tools
•
interactive maps
•
dashboards
• data structure • visual communication • interaction • business intelligence • forecasting • scenario tools • interactive maps • dashboards